You can now get a quick, up-to-date view of your social syndication performance with dlvr.it’s stats dashboard. The dlvr.it dashboard gives you a snapshot of the key metrics across all your social syndication routes, including audience growth, item clicks, posting volume, popular items, and geographic distribution.
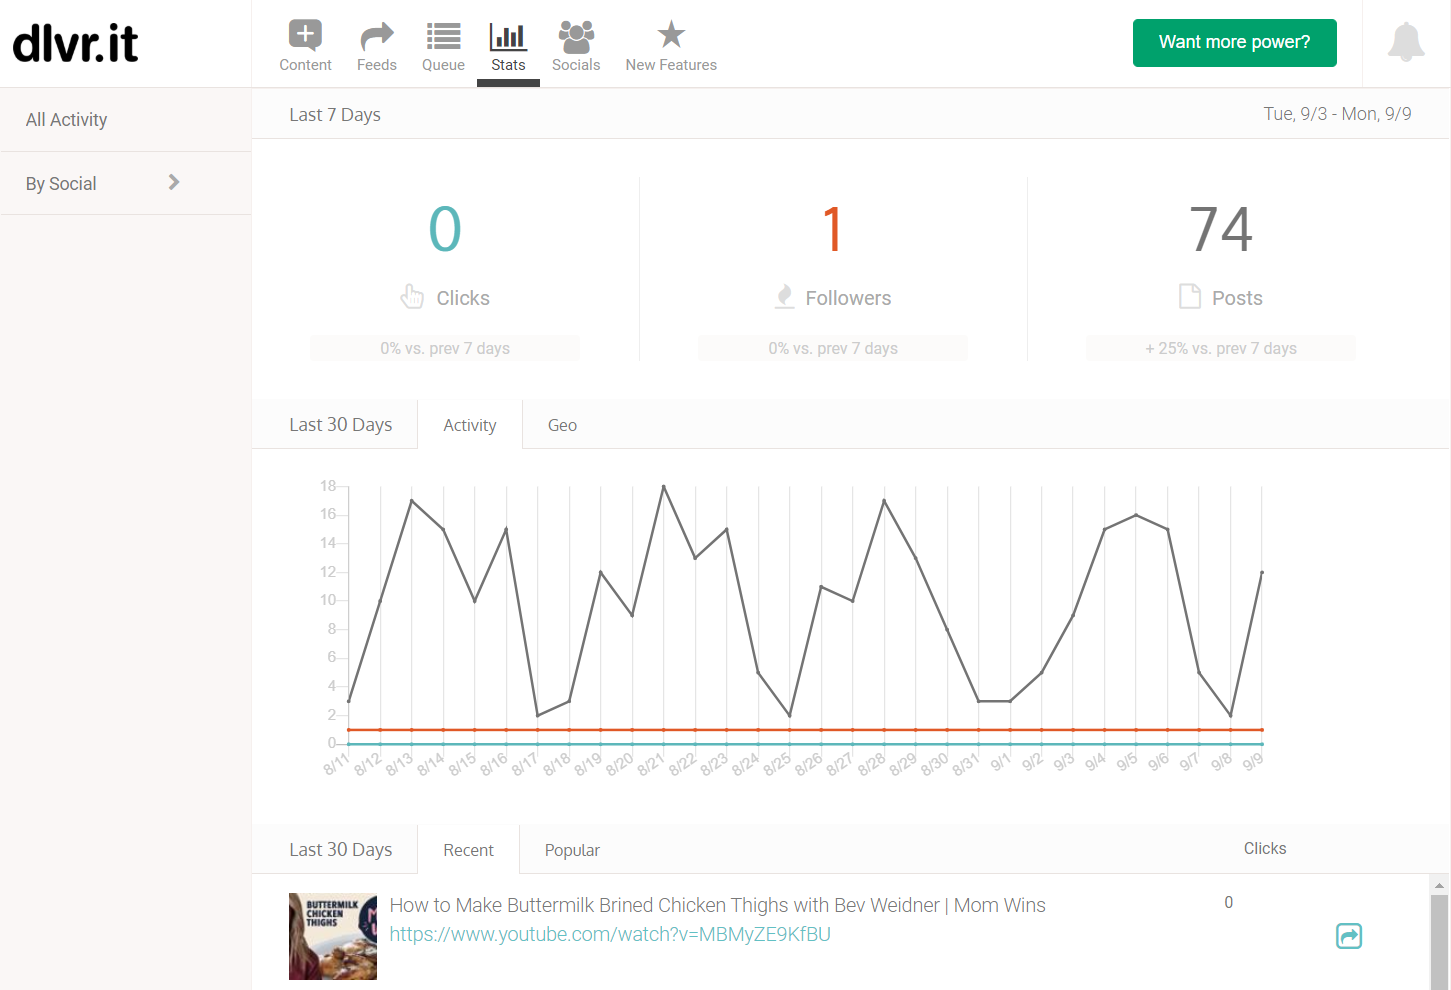
Followers:
The change in your total number of followers/friends across all your social networks for the last 24 hours. We also show you how that compares to the maximum/minimum daily follower changes over the last 30 days.
--Note: We are no longer able to provide follower counts for Facebook Groups above 5000.
Clicks:
The total number of clicks across all your Routes for the last 24 hours. We also show you how that compares to the most active and least active days over the last 30 days.
- Clicks data is only available for routes using dlvr.it short urls, and for accounts with bit.ly stats import enabled.
Posts:
The total number of posts made across all your Routes for the last 24 hours. We also show you how that compares to maximum and minimum daily post days over the last 30 days.
Popular Posts:
The most popular posts made in the previous 7 days, including the number of clicks.
- For accounts not using dlvr.it for short urls we display the most recent posts -- instead of the most popular.
Geo:
A global map of your click activity over the last 7 days.
- Geo data is only available for routes using dlvr.it short urls, and for accounts with bit.ly stats import enabled.
Social:
We now offer the ability to break down Stats by Social. You can find this tab on the left side of the Stats page and click on the Social that you would like to view.